Ivanti Service Management Portfolio UI V3
The Ivanti service management portfolio UI V3 module is the modernized version of the Classic UI V1 module. It provides an enhanced user experience with improved navigation, streamlined search, and configurable layouts. You can perform all the same tasks as in Classic UI V1, but with a more intuitive interface that reduces clicks and improves efficiency.
Ivanti service management portfolio UI V3 Home page
Layout Overview
When you sign in and open Home, the page contains three main areas:
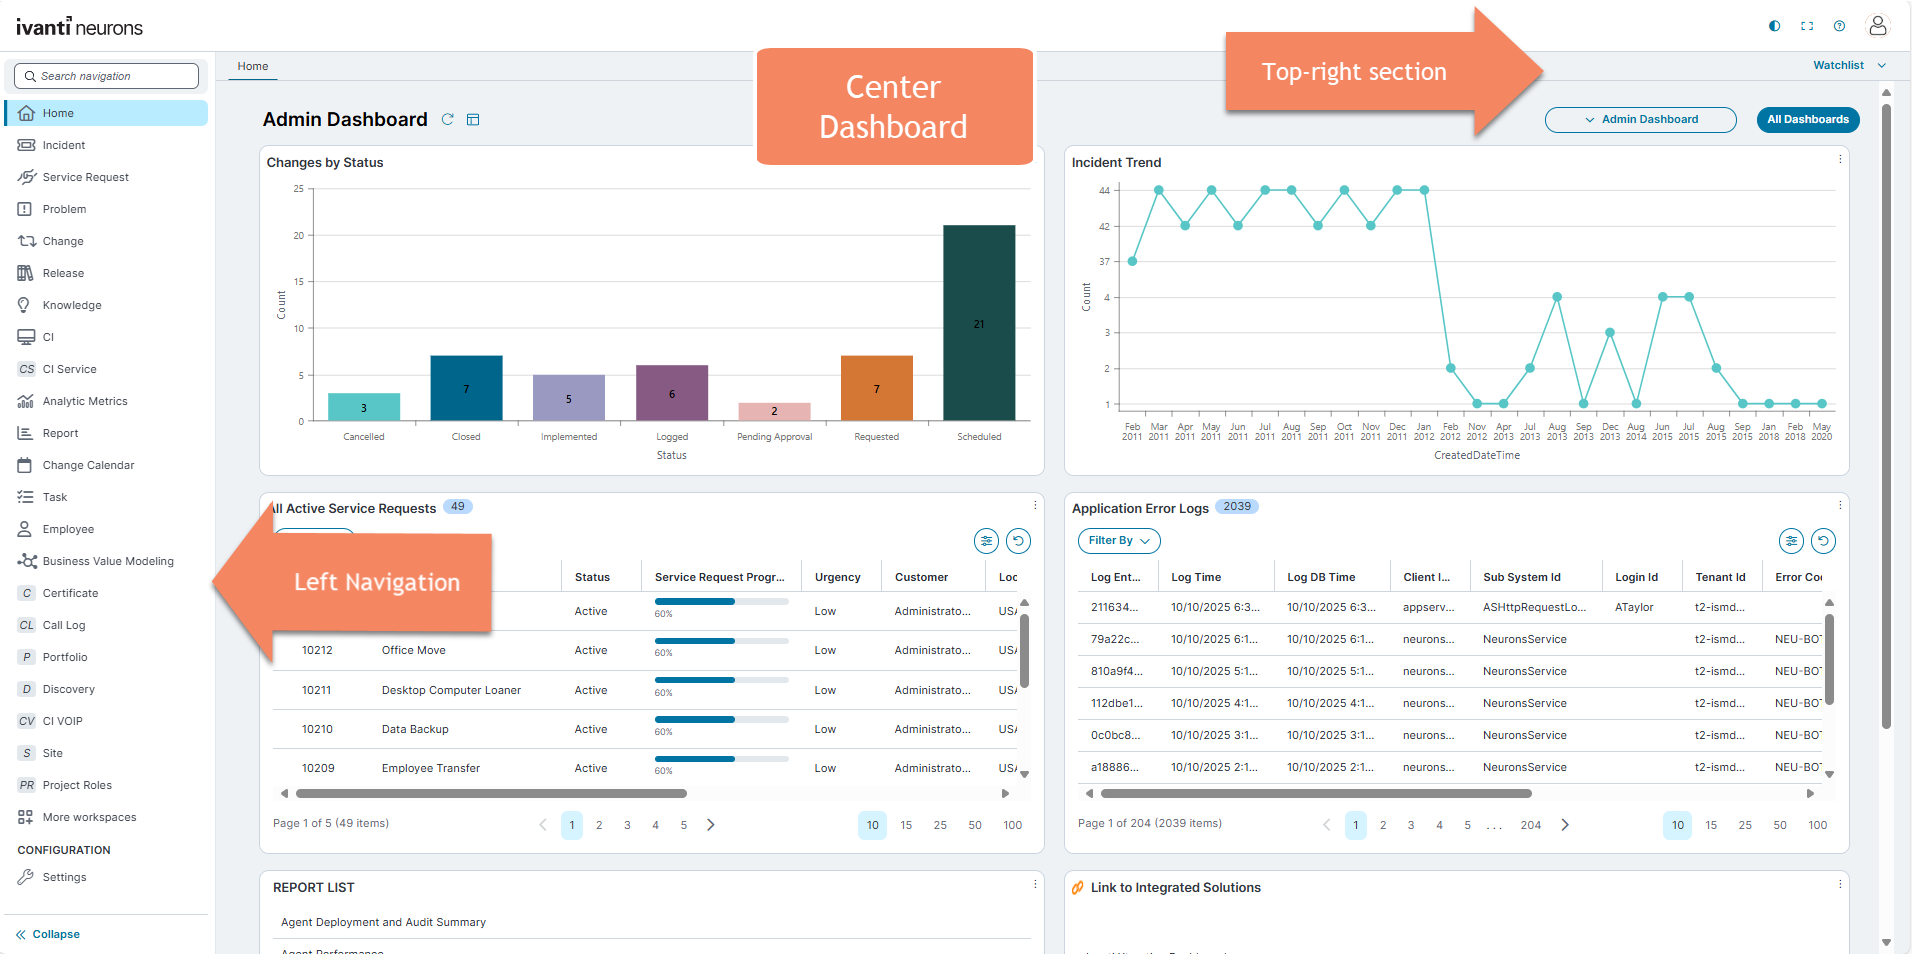
The Top-right corner includes quick-access icons and settings:
-
Theme toggle: Switch between Light mode and Dark mode.
Dashboard V2 supports Dark Mode for all components, including charts, tables, and other visual elements.
-
Full screen: Expand the view to full screen.
-
Help (?): Access the help menu.
-
User Profile:Change role, Change locale, Change password, Change picture and Logout.
-
Watchlist: Displays records pinned from the data grid.
-
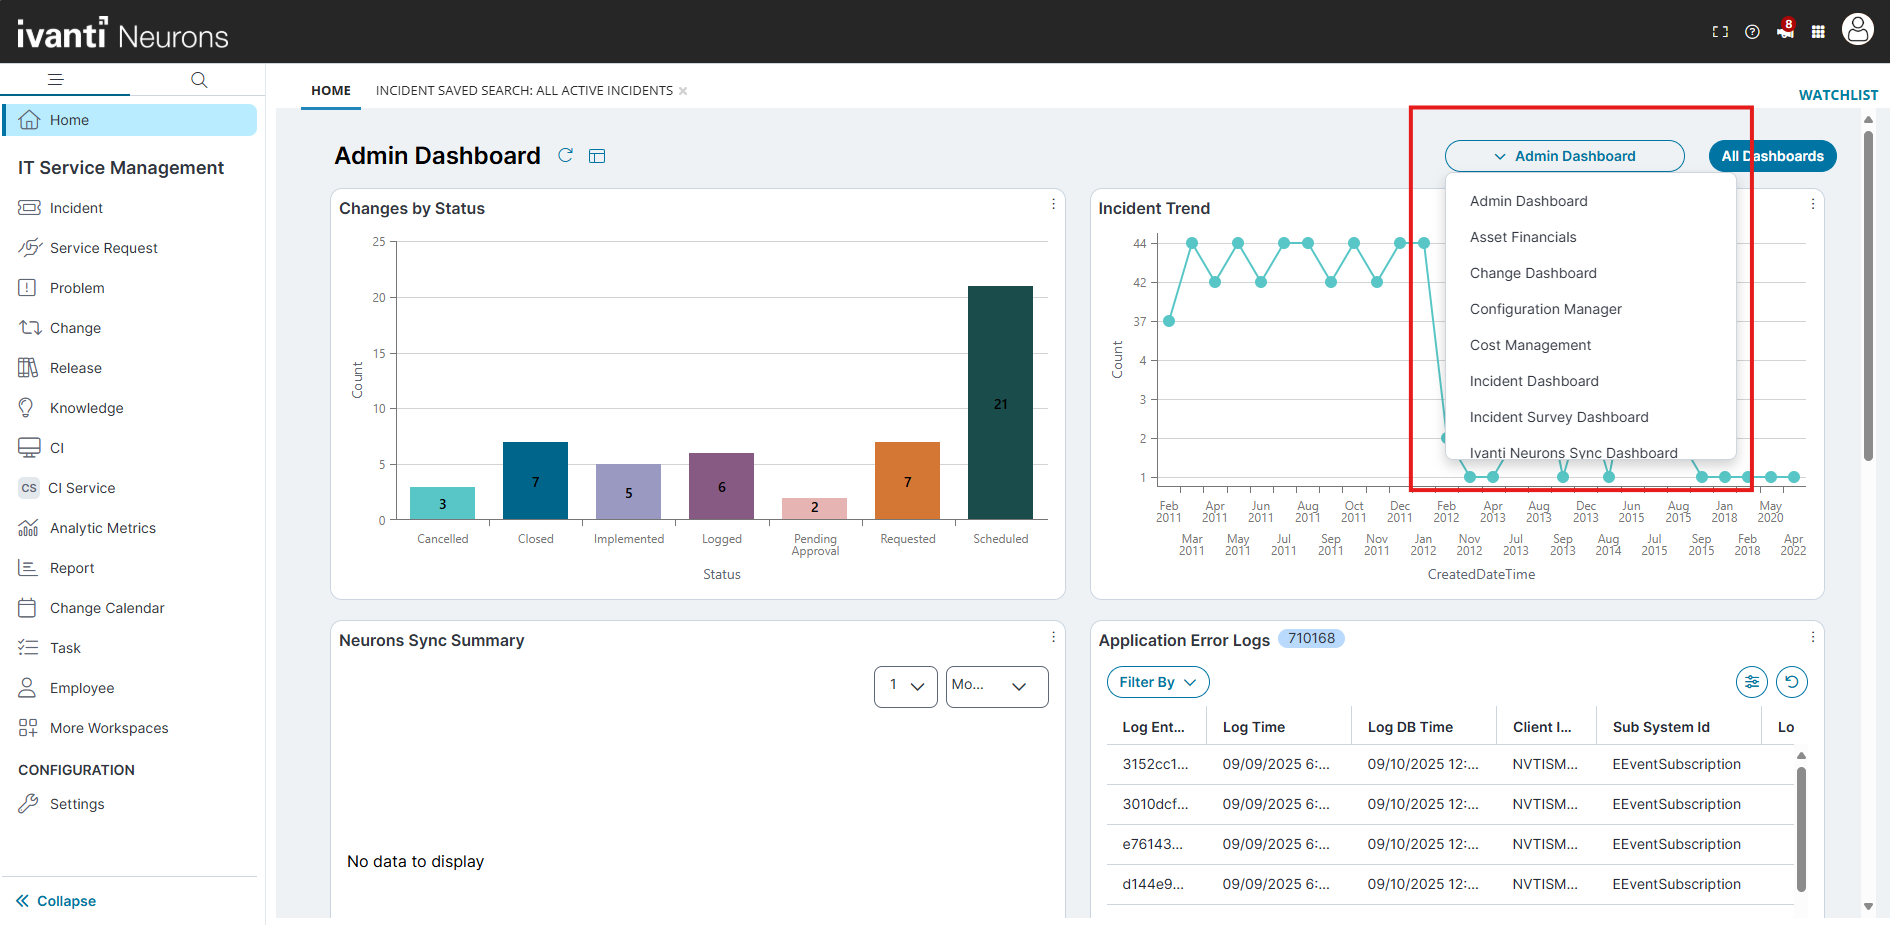
Dashboard controls:
-
A dropdown column to switch dashboards.
-
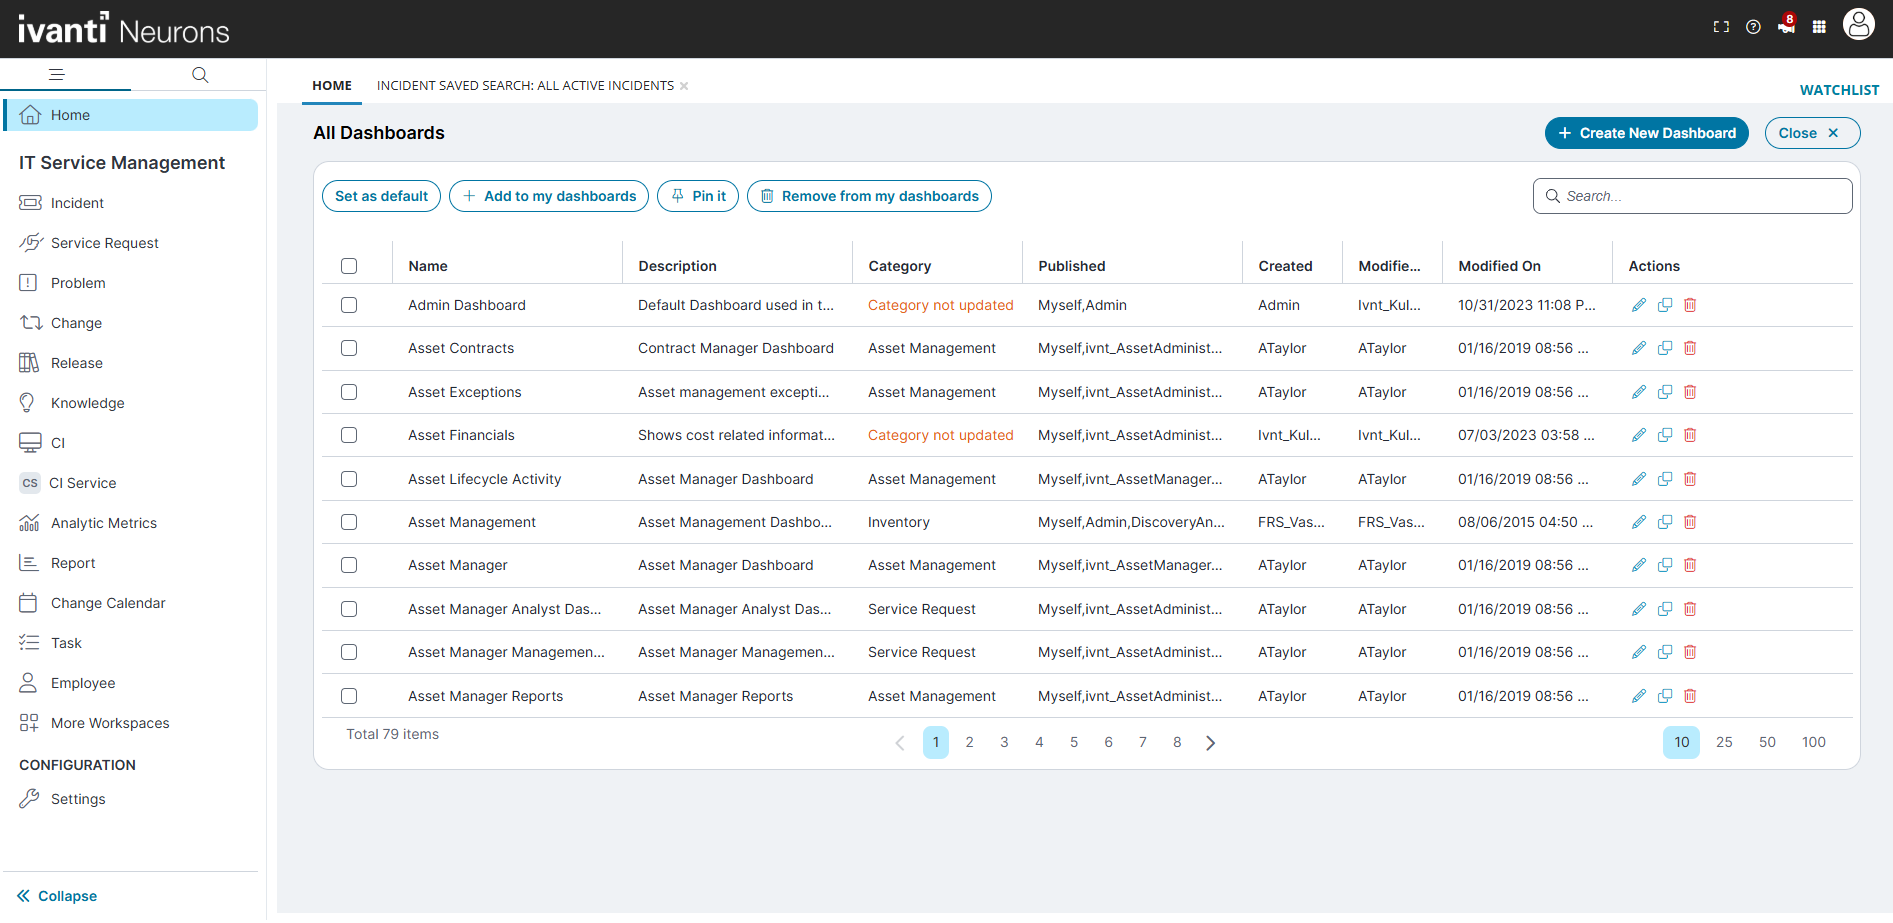
All Dashboards (button to open the dashboards list)
-
-
Home
-
IT Service Management section:
-
More Workspaces: At the bottom of the left navigation pane, select More Workspaces to access workspaces that may not be pinned to your primary navigation.
-
The More Workspaces page is divided into three sections:
-
Recently visited: Displays shortcuts to the workspaces you accessed most recently. This provides quick navigation back to commonly used workspaces.
-
My Workspaces: Lists the workspaces assigned to your role. These are displayed alphabetically for easier navigation. For example, Service Desk Analysts may see workspaces such as Incident, Problem, Change, or Report.
-
Additional Workspaces: Displays all other available workspaces that are not part of your current navigation pane. This section is also organized alphabetically. You can select any workspace to open it, even if it is not part of your default role-based navigation.
-
-
-
- Search: At the Top-right of the More Workspaces page, you can use the Search workspaces box to quickly locate a workspace by name.
-
CONFIGURATION section:
-
Settings (navigates you to Admin Dashboard)
-
-
Collapse (button at the bottom to hide the pane)
The example view shows the Admin Dashboard with these widgets:
-
Changes by Status (column chart)
-
Incident Trend (line chart)
-
Neurons Sync Summary
-
Application Error Logs (table with a Filter By control)
-
Pagination controls: Located at the bottom of the page. Use these to change the number of filters displayed per page (10, 25, 50, or 100) and navigate between pages.